
To interpret pump curves like an engineer, focus on the flow rate (horizontal axis) and head (vertical axis), recognizing their inverse relationship. Identify key zones such as the Best Efficiency Point (BEP), startup, and shutdown areas, which indicate ideal operation and potential risks. Pay attention to efficiency and power curves to gauge energy use. If you keep exploring, you’ll discover how to optimize system performance using these essential performance indicators.
Key Takeaways
- Identify flow rate on the horizontal axis and corresponding head on the vertical axis to understand pump performance.
- Observe the inverse relationship: as flow increases, head decreases, indicating capacity at different operating points.
- Locate the Best Efficiency Point (BEP) on the curve to determine optimal pump operation.
- Examine different zones—startup, BEP, high-flow—to assess performance limits and prevent damage.
- Use efficiency and power curves alongside the main pump curve for comprehensive system optimization.
Top picks for "pump curv read"
Open Amazon search results for this keyword.
As an affiliate, we earn on qualifying purchases.
Understanding the Basics of Pump Curves
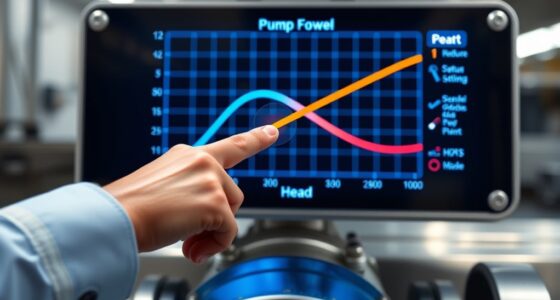
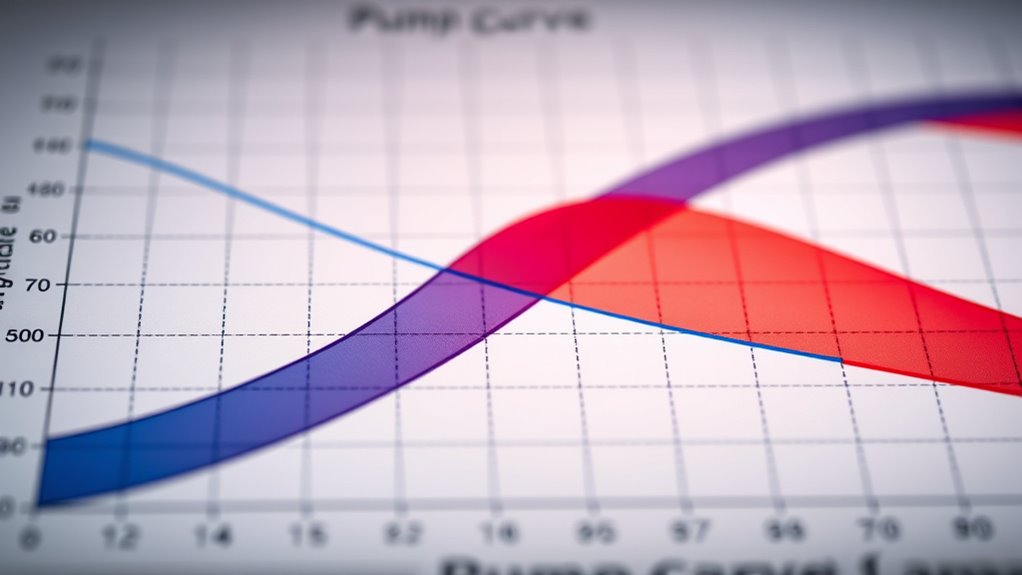
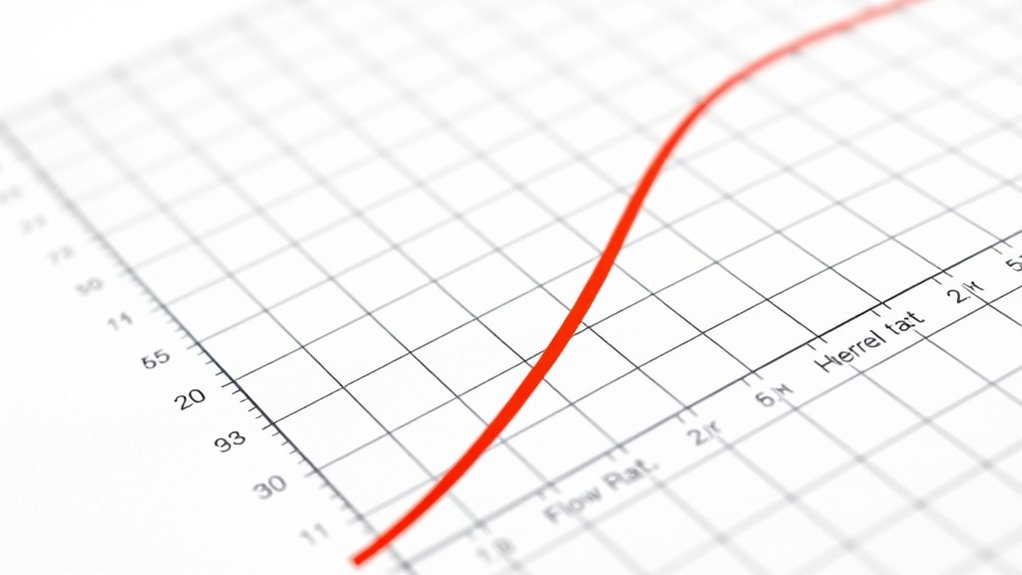
Understanding the basics of pump curves is essential for selecting and operating pumps effectively. These curves visually represent how a pump performs under different conditions, showing the relationship between flow rate and head pressure. When you look at a pump curve, you’ll notice it plots flow on the x-axis and head on the y-axis. As you increase the flow rate, the head typically decreases, illustrating the pump’s capacity to move fluid at various speeds. Recognizing this relationship helps you determine the pump’s best operating point, ensuring efficiency and preventing damage. By understanding the shape of the curve, you can anticipate how changes in system conditions affect performance. This knowledge allows you to match the right pump to your application, optimizing operation and prolonging equipment lifespan. Additionally, understanding pump performance characteristics is crucial for troubleshooting and maintenance.
Components of a Typical Pump Curve
A typical pump curve shows how head and capacity are related, helping you understand how the pump performs under different conditions. You’ll also see efficiency and power curves, which reveal how effectively the pump operates and how much energy it consumes. Recognizing these components makes it easier to select the right pump for your application. Additionally, understanding performance indicators on the graph can assist in optimizing your pump’s operation.
Head and Capacity Relationship
The head and capacity relationship is a fundamental aspect of a typical pump curve, illustrating how a pump’s ability to lift fluid changes with varying flow rates. As flow increases, the head (pressure) decreases. This inverse relationship helps you determine the pump’s performance at different points. To visualize this, consider the following:
| Flow Rate (GPM) | Head (Feet) |
|---|---|
| Low | High |
| Medium | Moderate |
| High | Low |
This table shows that at low flow rates, the pump generates high head, while at high flow rates, the head drops. Understanding this relationship assists you in selecting the right pump for a specific application, ensuring ideal performance and efficiency.
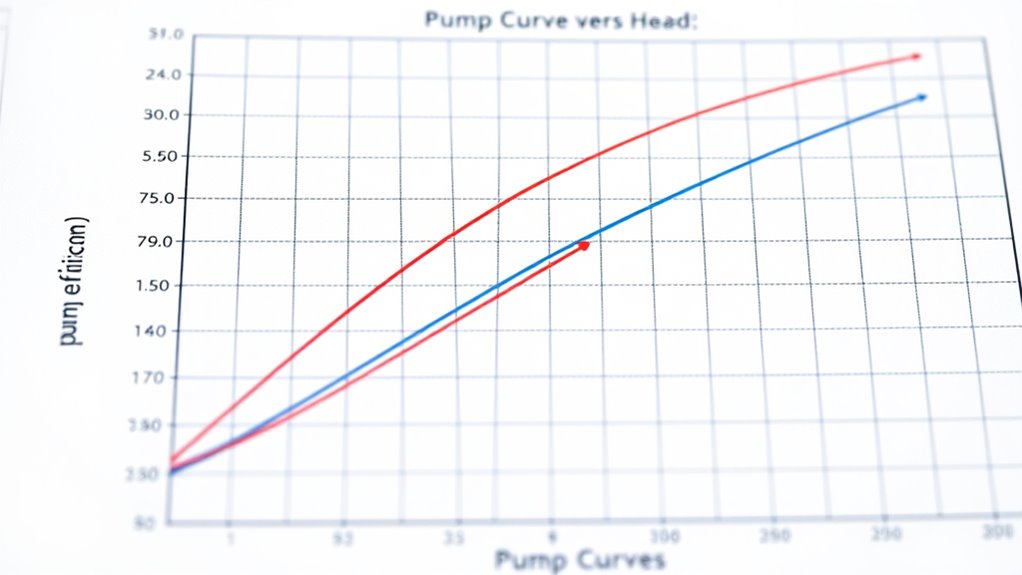
Efficiency and Power Curves
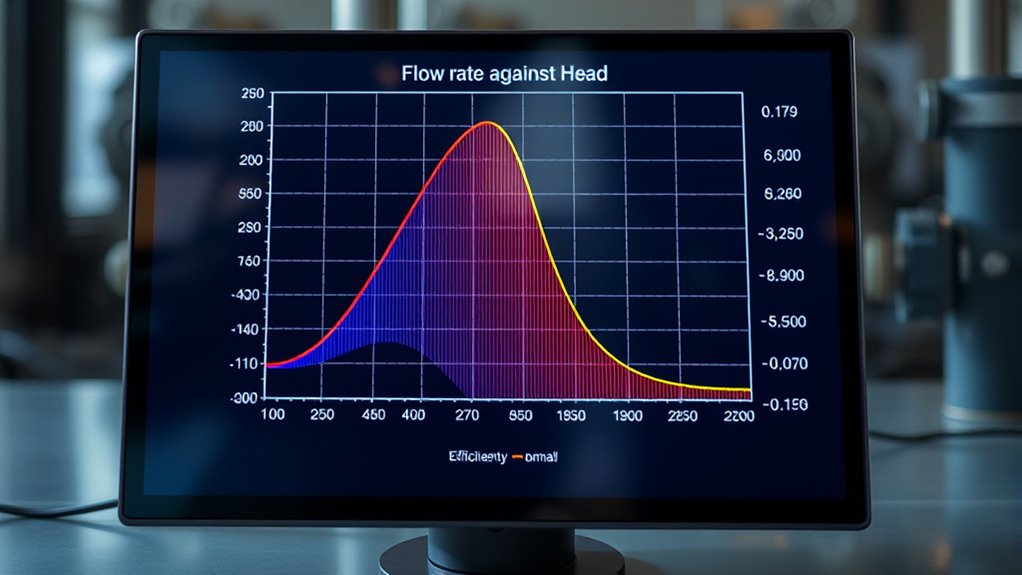
Efficiency and power curves are key components of a typical pump curve, providing insight into how well a pump performs at various operating points. The efficiency curve shows where the pump operates most effectively, usually peaking at a specific flow rate. Operating near this peak ensures minimal energy waste. The power curve indicates the power consumption at different flow rates, helping you identify where the pump requires the most energy. As flow increases or decreases from the optimal point, efficiency drops, and power consumption changes accordingly. By analyzing these curves, you can determine the most energy-efficient operating point, enhance performance, and avoid overloading the pump. Understanding these curves helps you select the right pump size and operating conditions for your system’s needs. Additionally, being aware of regional factors can influence pump selection and efficiency, especially in areas with high demand or specific environmental conditions.
Interpreting Flow Rate and Head on the Graph
When you look at a pump curve, start by reading the flow rate on the horizontal axis to understand how much fluid the pump moves. Next, examine the head values on the vertical axis to see the pressure the pump can generate at that flow. Finally, identify the performance zones to determine where the pump operates most efficiently and within safe limits. Additionally, analyzing the pump’s performance metrics, such as pressure capabilities and efficiency zones, helps in selecting the right pump for specific projects and ensures optimal operation.
Reading Flow Axis
Understanding the flow axis on a pump curve is essential for interpreting how the pump performs under different conditions. The horizontal axis shows the flow rate, typically in gallons per minute (GPM) or liters per second (L/s). It indicates how much fluid the pump delivers at various operating points. When reading this axis, remember that higher flow rates usually mean lower head, and vice versa. To clarify, consider this table:
| Flow Rate (GPM) | Pump Performance |
|---|---|
| Low | Suitable for high head, low flow applications |
| Moderate | Balanced flow and head |
| High | High flow, lower head |
| Very High | Overloading risk, check pump limits |
| Zero | No flow, pump idle |
Accurate interpretation helps you match the pump to your system’s needs effectively. Additionally, understanding the relationship between flow rate and head can assist in optimizing system performance.
Analyzing Head Values
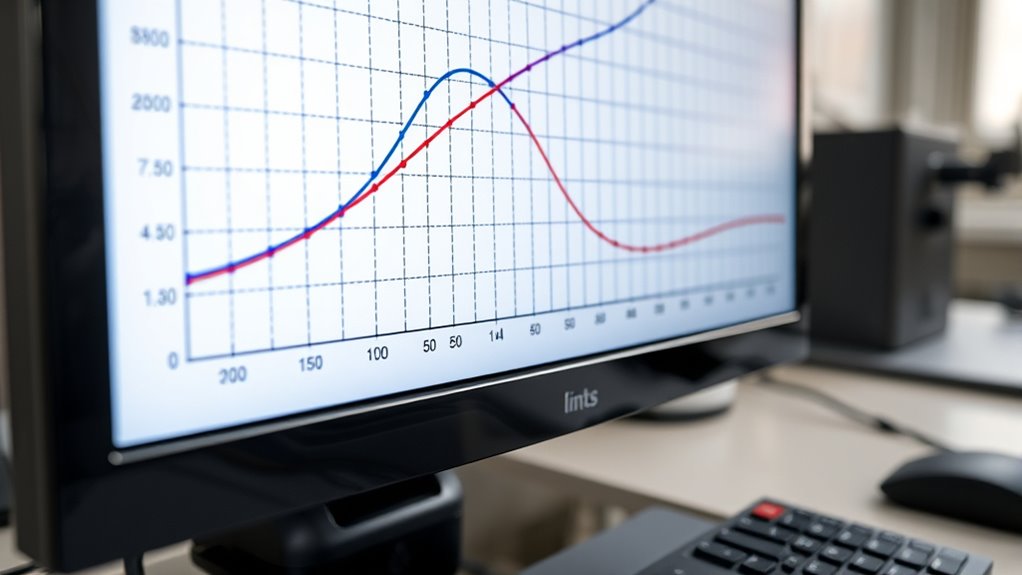
To analyze head values on a pump curve, focus on how the head varies with different flow rates. As you move along the curve, observe the head at each flow point. Typically, the head decreases as flow rate increases, indicating an inverse relationship. Higher head values appear at lower flow rates, which means the pump can generate more pressure with less flow. Conversely, at higher flow rates, the head drops, showing the pump’s capacity diminishes under those conditions. Pay attention to the shape of the curve: a steep slope suggests significant head loss with increasing flow, while a flatter section indicates more stable pressure. Understanding these variations helps you determine if the pump matches your system’s requirements for pressure and flow at different operating points. Additionally, contrast ratio influences how well the pump can perform under varying conditions, especially in systems with fluctuating demands.
Identifying Performance Zones
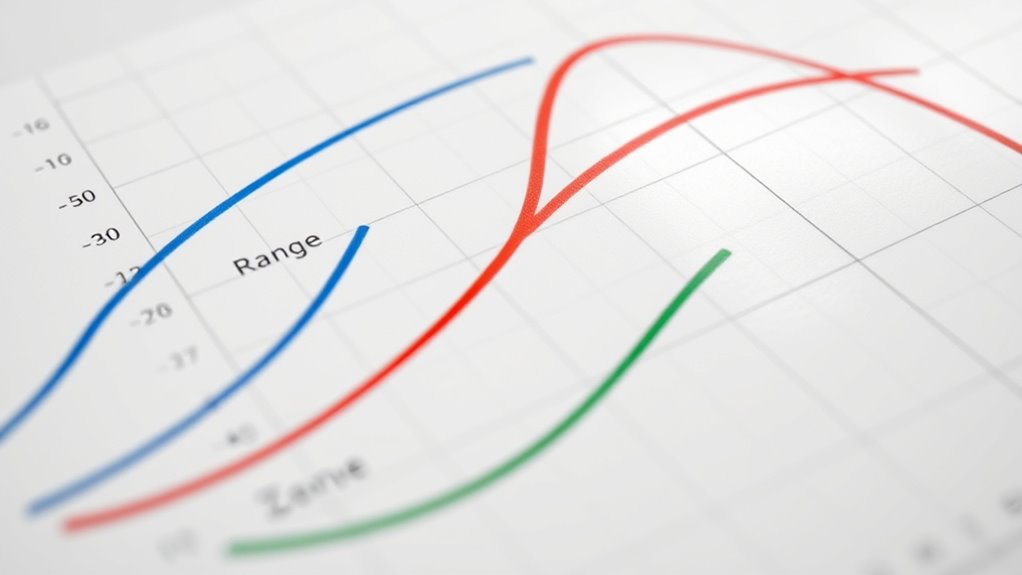
Identifying performance zones on a pump curve involves examining how flow rate and head interact across different regions of the graph. Typically, you’ll see three main zones: the startup or low-flow zone, the ideal or best efficiency point (BEP), and the high-flow or shutdown zone. The startup zone occurs at low flow rates with high head, where the pump struggles to deliver consistent performance. The BEP is where the pump runs most efficiently, balancing flow and head for ideal operation. Beyond this, the high-flow zone shows decreasing head as flow increases, indicating the pump is approaching its limits. Recognizing these zones helps you select the right operating point, avoid excessive wear, and ensure energy-efficient performance. Knowing where your pump operates on the curve ensures reliable and cost-effective operation. Additionally, understanding the performance zones allows for better prediction of pump behavior under different load conditions, contributing to optimal maintenance schedules and operational efficiency.
The Significance of the Pump Curve Zones
The pump curve is divided into distinct zones that reveal how a pump performs under different conditions, making these zones vital for proper operation. Each zone indicates specific performance characteristics and helps you determine whether the pump operates efficiently or risks damage. The operating point within the curve’s zones shows if the pump is running at its best efficiency, or if it’s overloaded or underperforming. Recognizing these zones enables you to select the right pump for your system, avoid unnecessary wear, and optimize energy use. Misinterpreting the zones can result in costly issues like cavitation or reduced lifespan. Understanding vertical storage solutions and the significance of each zone, you guarantee your pump runs reliably, efficiently, and within safe parameters. This knowledge is essential for maintaining system performance and longevity.
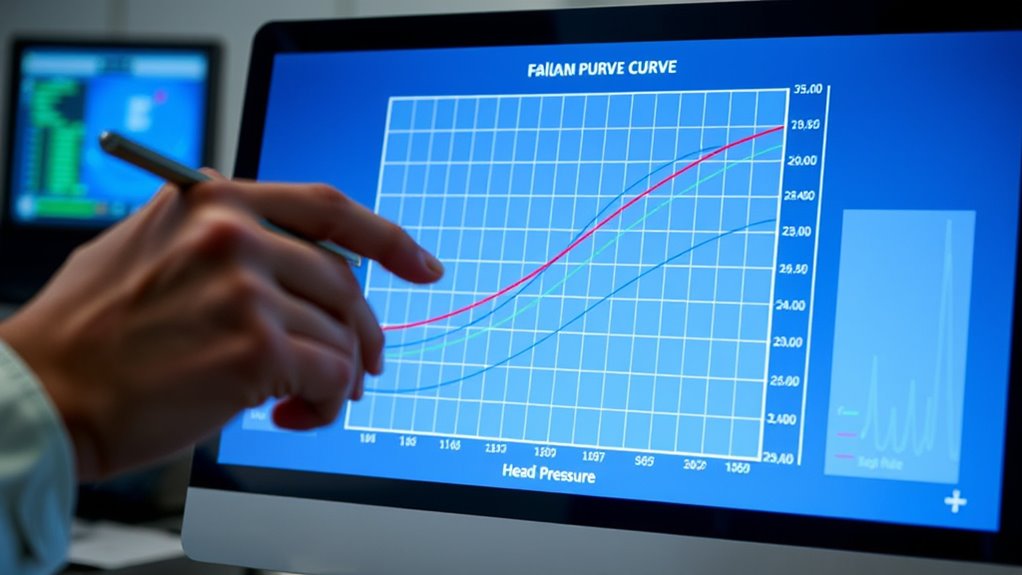
How to Read Efficiency Curves
Understanding how to read efficiency curves is essential for optimizing pump performance. These curves show how effectively a pump operates at different flow rates. Look for the efficiency curve line, usually labeled with percentages. As you follow the curve, you’ll notice efficiency rises to a peak and then drops off. The highest point on the curve indicates the best efficiency point (BEP), where the pump performs most effectively. Lower efficiency areas suggest increased energy waste. When evaluating a pump, compare the efficiency at your desired flow rate to ensure you’re operating near the BEP. Keep in mind, efficiency curves help you identify ideal operating conditions, reducing energy costs and prolonging equipment life. Proper interpretation ensures you select and operate pumps at their most efficient points. Additionally, understanding different types of hackathons can provide insights into innovative problem-solving environments that might inspire better pump designs or operational strategies.
Identifying Shut-off and Best Efficiency Points
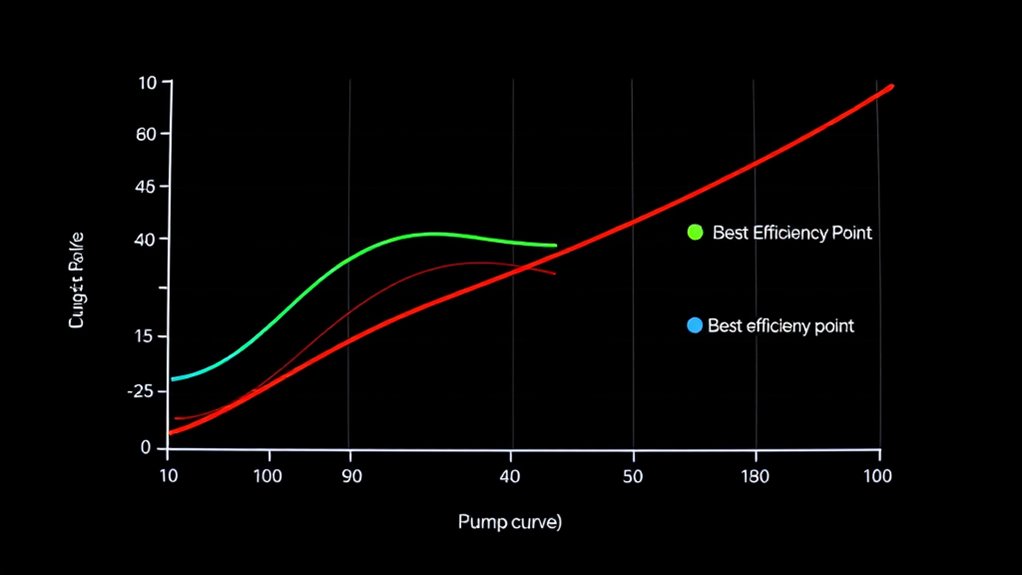
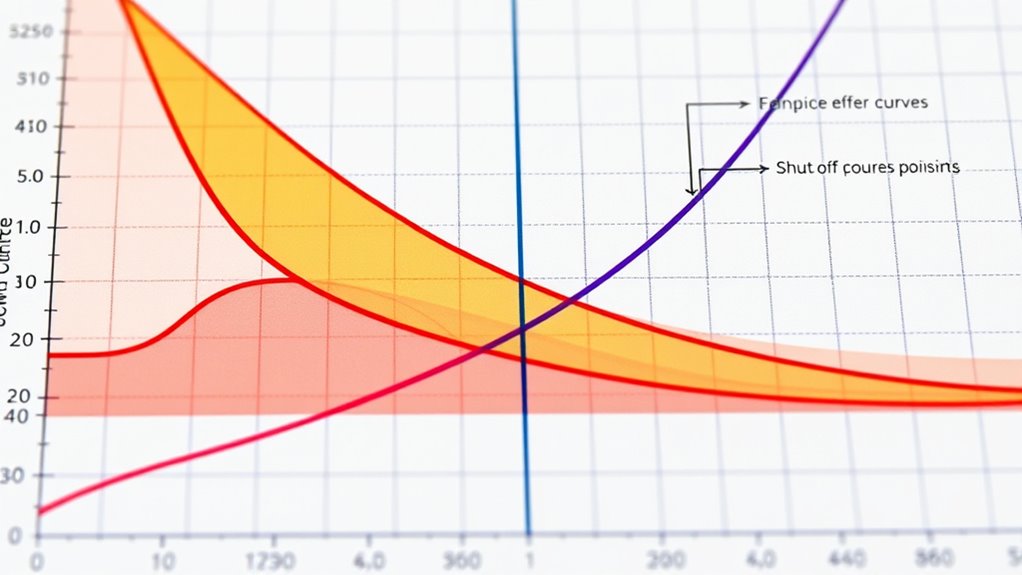
When analyzing pump performance curves, recognizing the shut-off point and the best efficiency point (BEP) is essential for ideal operation. The shut-off point occurs at zero flow, where the pump’s head reaches its maximum. You’ll see this at the far left of the curve, indicating no liquid is flowing through the pump. The BEP is where the pump operates most efficiently, usually marked by the peak of the efficiency curve. This point balances flow and head, ensuring peak performance without excessive energy use or wear. Identifying these points helps you select the right pump for your system and avoid operating conditions that could cause damage or reduce lifespan. By understanding these key points, you can improve pump longevity and system reliability. Properly operating within the BEP can also extend equipment lifespan and optimize overall system efficiency.
Analyzing System Curves in Conjunction With Pump Curves
Analyzing system curves alongside pump curves allows you to determine how well a pump matches the specific hydraulic demands of your system. You’ll plot the system curve, which shows the relationship between flow rate and head loss at different operating points. By overlaying the pump curve, you can identify the intersection point, indicating the actual operating flow and head. This helps you assess whether the pump operates efficiently within its best efficiency point or if adjustments are needed. If the intersection is far from the pump’s BEP, it could lead to higher energy consumption or equipment wear. Comparing the curves also reveals potential issues, such as insufficient flow or excessive pressure, enabling you to optimize system performance and select the most suitable pump for your application.
Common Types of Pump Curves and Their Features
There are several common types of pump curves, each designed to represent different pump behaviors and performance characteristics. The most typical is the residential or centrifugal pump curve, which shows a steep decline in head as flow increases, indicating efficiency at various points. The axial flow pump curve features a relatively flat shape, meaning it maintains a constant head over a wide range of flows, ideal for high-volume, low-pressure applications. The mixed flow pump curve combines features of both, with a moderate slope and a balance between flow and head. Finally, the submersible pump curve usually has a curve that accounts for variations in head due to depth changes. Recognizing these types helps you interpret pump performance and select the right pump for specific system needs.
Practical Tips for Using Pump Curves in System Design

Using pump curves effectively in system design requires understanding how to interpret their key features. First, focus on the system curve, which shows your system’s demand at various flow rates. Match the pump curve to this system curve to find the operating point where both intersect; this indicates the flow rate and head the pump will deliver under actual conditions. Always consider the pump’s efficiency zone to maximize energy savings and reduce wear. Be mindful of the pump’s shut-off head and flow limits to avoid overloading or cavitation. Use multiple curves to evaluate different pump options quickly. Remember, accurate system data and clear goals help you select the right pump, optimize performance, and prevent issues down the line.
Troubleshooting and Diagnosing Pump Performance With Curves
When pump performance issues arise, comparing actual operating data to the pump curve can reveal the root cause. First, check if the flow rate matches the curve’s expected values; a lower flow might indicate partial blockage or pump wear. Next, examine the head or pressure; if it’s consistently below the curve, the pump could be losing efficiency or experiencing cavitation. Pay attention to power consumption—higher than normal readings often suggest mechanical issues or impeller damage. If the pump runs at a different point on the curve than expected, it may be misaligned or operating under incorrect system conditions. Regularly monitoring these parameters against the curve helps you identify problems early, enabling timely repairs and restoring ideal performance.
Frequently Asked Questions
How Do Temperature Variations Affect Pump Curve Readings?
Temperature variations can notably impact pump curve readings. As temperature increases, fluid viscosity decreases, which often results in higher flow rates and slightly lower head pressures. Conversely, colder temperatures increase viscosity, reducing flow and head. You might notice shifts in the pump’s performance curves, so it’s essential to account for temperature changes when analyzing pump efficiency and ensuring ideal operation under different conditions.
Can Pump Curves Predict Long-Term Pump Performance?
Yes, pump curves can predict long-term performance if you regularly update them with current operational data. By monitoring changes in flow rate, head, and efficiency over time, you can spot trends indicating wear or issues. This proactive approach helps you anticipate maintenance needs, optimize operation, and extend your pump’s lifespan. Keep track of your pump’s actual performance against the curve to make informed decisions for future performance.
How Do Different Fluid Viscosities Influence Pump Curves?
Think of fluid viscosity as the thickness of honey versus water—thicker fluids make your pump work harder, shifting the pump curve downward. Higher viscosity increases resistance, reducing flow rate and head, while lower viscosity allows smoother operation. You’ll see these effects clearly on the pump curve, as it will show decreased performance with more viscous fluids. Adjustments to pump speed or size might be necessary to maintain efficiency.
What Is the Impact of Pipe Friction on the Pump Curve?
Pipe friction reduces the pump’s flow rate and head, shifting the pump curve downward. As friction increases, you’ll notice a drop in efficiency and a need for more input power to overcome resistance. This effect causes the system curve to rise, meaning you must select a pump capable of handling higher head at lower flow. You’ll want to account for pipe friction during system design to guarantee ideal pump performance.
How Can Pump Curves Assist in Selecting the Right Pump for Specific Applications?
Pump curves propel your selection process by pinpointing the perfect pump, preventing potential problems. They provide precise data on flow rates, pressure, and efficiency, helping you match equipment to your needs. By analyzing the curves, you spot the most suitable pump that maximizes performance and minimizes costs. With clear, all-encompassing charts, you confidently choose the right pump, ensuring smooth, successful system operation and long-term reliability.
Conclusion
Mastering pump curves is like revealing a treasure map—each line and curve guides you to ideal performance. By understanding these graphs, you can confidently navigate system design and troubleshoot issues before they become storms. Think of the pump curve as your compass, pointing you toward efficiency and reliability. With practice, you’ll read these charts like an open book, turning complex data into clear directions on your journey to a smoothly running system.